 Applying the FLOAT Method to Qualitative Data
This little missive outlines how the FLOAT Method can be applied to qualitative data. It was written for a presentation at 2026 Medical Library Association Annual meeting, and the one-page handout is available here.
What Is FLOAT?
FLOAT is an acronym where each letter stands for a different part of a research process:
- F - Formulate one or more research questions, and the research questions can range from the mundane to the sublime; example questions might include, "What is the size and scope of this collection?" or "How has the treatment of papillomavirus changed over time?"
- L - Locate a sustainable data source, and when it comes to qualitative data the sustainable data will come from places such as bibliographic indexes, scrapings of the Internet, social media feeds, the qualitative parts of a survey, etc.
- O - Organize your data source, and in Library Land we call this process "curation"; this is where the qualitative data is normalized, classified, segmented, augmented, and coerced into some sort of data structure which is usually a matrix, a relational database, or a JSON stream.
- A - Analyze your data source; this is an automated process and it falls into two types of analysis: 1) counting and tabulating features of the data, and 2) apply one or more different modeling techniques against the data such as topic modeling, semantic indexing, full text indexing, network graph analysis, etc.
- T - Tell a data-driven story; the previous step results in the generation of measurements, and these measurements ought to be visualized for the purposes supplementing the narrative addressing the research question(s).
The concept of FLOAT was articulated by Kenton Rambsy and Peace Ossom-Williamson, I would add an additional letter to the acronym:
- S - Start over; the research process is never done; moreover the process is iterative and not done in sequential order because a question may be articulated but no data can be found, or data is found and a more interesting research question is articulated, or the analysis shows one thing but the question posited another, etc.
It Takes a Team, Usually
It is entirely possible to practice FLOAT as an individual, but as the size and scope of the research questions increase so does the need to include the expertise of additional people. For example, the person articulating the research question -- whom we will call the "domain expert" -- is able to elaborate on the questions and may have an idea of where appropriate data sources are located, but they often have little idea of how to organize nor analyze the data except through the processes of bibliography and close reading.
The location and organization of data are typically librarian activities, but data scientists can also pay a role. For example, data scientists ought to be able to augment the process by putting data into structures more expressive than spreadsheets. Similarly, while the counting and tabulating of extracted features is relatively easy and can be done by almost anybody using a tool called OpenRefine, the application of various clustering techniques (topic modeling, KMeans, etc.), supervised classification, regression, or feature reduction (like PCA) will be more efficiently done by a data scientist.
Graphic designers may be part in FLOAT because they ought to be more able to create visualizations with a greater aesthetic appeal than others. A picture may be worth a thousand words, but a pretty picture is more compelling.
In sum, the process of doing FLOAT may require a team including: domain experts, librarians, data scientists, and graphic designers. And a significant in the previous sentence is "team"; each person is expected to work collaboratively with the others. There is no I in FLOAT.
Analyze, More Specifically
I suspect you, dear reader, are more familiar with the F, L, O, and T of FLOAT, and in this section I will outline some of the ways the A can be accomplished.
An alternative word for "analysis" is "modeling" where the researcher observes the given data in a number of different ways in order to garner different perspectives. The process is very much akin to life-drawing sessions where a person stands in the center of a room and many artists sketch the model. The person in the middle of the room is a model of the human form and the artists observe the model literally drawing conclusions. Each artist sees the same thing, but from different angles and uses different pencils, pens, and paints to illustrate what they observe. The A in FLOAT is the same process, but in this case the person is the data.
Counting and tabulating extracted features is probably the simplest analysis ("modeling") technique. For example, the researcher can count the number of words in a document and then compare and contrast the sizes of documents over the whole corpus. Other extracted features one can count and tabulate include: ngrams (individual words, two-word phrases, etc.), words from different parts-of-speech (nouns, verbs, adjectives, etc.), named-entities (people's full names, organizations, dates, money amounts, etc.), and keywords (words denoting the "aboutness" of documents). By counting and tabulating these things, the researcher can address questions such as: what is discussed in this corpus, what do they do, how are they described, or is the tone ("sentiment") positive or negative. If the given data is associated with metadata such as time, place, or authorship, then questions such as how have the words usage -- think "ideas" -- ebbed and flowed over time, what happened here versus what happened there, or what did this author have to say about what can all be addressed.
Concordancing is a modeling technique dating back to the 13th Century, and it addresses the age old question, "When this word is mentioned, what other words are nearby?". This technique was much more recently articulated by John Firth who said, "You shall know a word by the company it keeps."
Full text indexing is another well-understood modeling technique. It riffs off the printed indexes and catalogs of yore. Indexes are models of qualitative data; they are representations of the collections of narrative information, and you might say full text indexes are upside-down because things like subject headings point to narrative texts as opposed to the other way around.
More modern analysis techniques include clustering which divide a corpus into subcorpora. Topic modeling and KMeans are two example algorithms. Given a collection of text and an integer, both of these techniques identify sets of words which are similarly distant from other words, and in the end, the sets of words often connote themes. Again, these themes can be plotted over metadata values such as authors or times to illustrate how things can be attributed or how they ebbed and flowed.
Semantic indexing takes the quip of Mr. Firth to a new level. Given a word plotted in an n-dimensional space with other words from the corpus, semantic indexing identifies similar words to the given word but not in the morphological sense and instead in the meaning sense. This is quite useful for identifying similar themes but expressed in different ways.
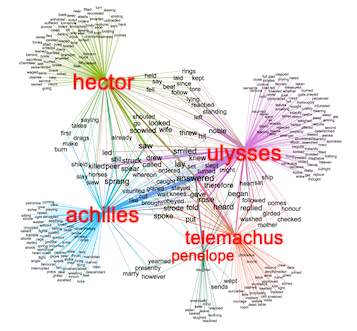
Network graph |
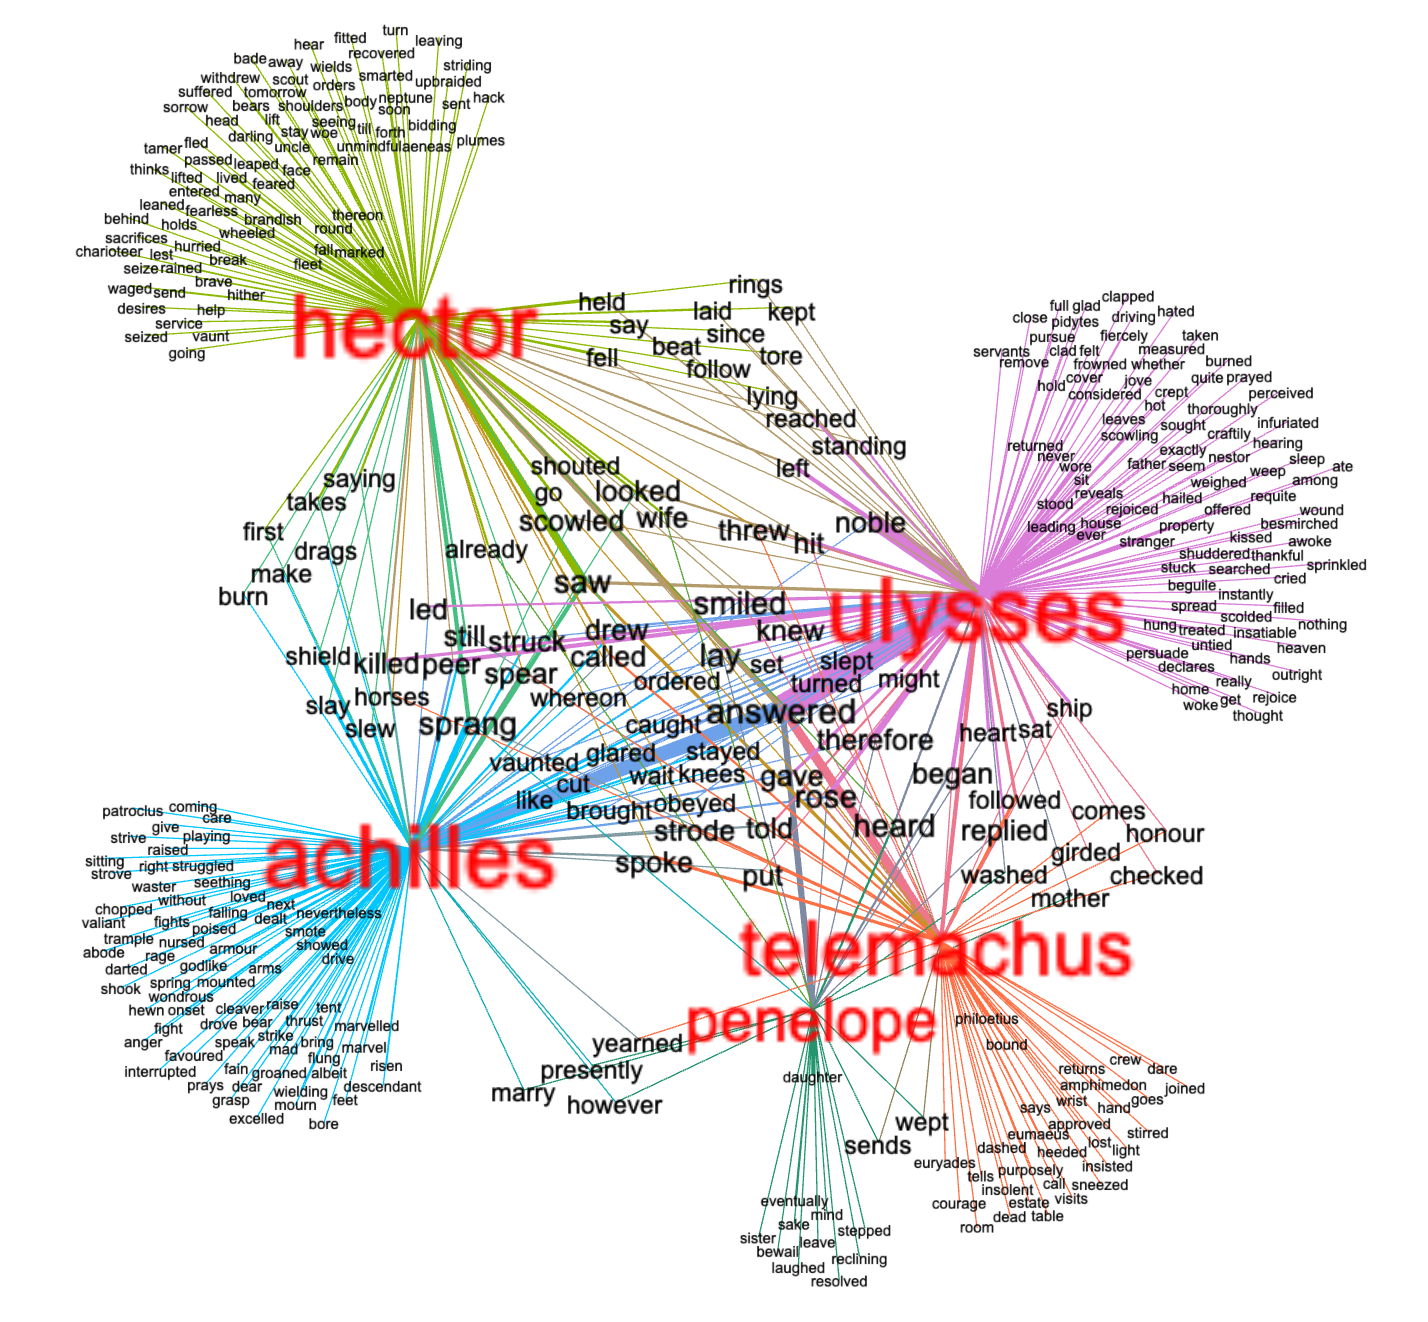
Vectorization or "embedding" is the newest modeling technique. It is at the core of generative-AI. In vectorization a complete list of all words from everywhere ("tokens") is created -- billions of words/tokens. Sentences from a given corpus are then compared to the complete list, and the result is a list of real numbers representing ("modeling") the sentence. These lists of numbers are called "vectors", and given the one or more vectors, their differences ("distances") between them can be computed through the use of linear algebra.
All of the things outlined above ultimately describe and point to complete texts, individual sentences, or individual words. Given the descriptions, the texts, the sentences, and the words, the traditional analysis process comes into play -- close reading.
Summary
FLOAT is a research method. It is a process of articulating a research question, pointing to content that may address the question, getting and curating the content, modeling the content, visualizing the results, writing up the results, and starting over. FLOAT is a never-ending process, and it can be applied to qualitative data just as easily as quantitative data.
Creator: Eric Lease Morgan <eric_morgan@infomotions.com>
Source: This essay was written for a presentation at the 2026 Medical Library Association Annual Meeting, specifically, a presentation called "A Pie Walks into a Bar".
Date created: 2026-05-18
Date updated: 2026-05-18
Subject(s): FLOAT;
URL: http://infomotions.com/musings/float/